Posts

Meet your Mets: Senior Meteorologist Dustin
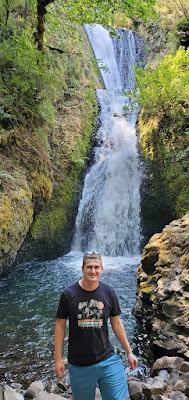
Image
 Welcome Senior Meteorologist Dustin!  Dustin has been working at NWS Reno since October, and it has been great to have him back. Here's a little bit more about his NWS journey.  As a Florida native, Dustin has been fascinated by the weather from a very early age. His interest and inevitable career path were cemented by a few significant events during his childhood. In particular, 1998 stood out as a devastating year for Central Florida which saw both the deadliest tornado outbreak and worst wildfire season in Florida's history. Combined with the 2004 & 2005 hurricane seasons, Dustin was determined to work as a meteorologist with the National Weather Service. Shortly after receiving his B.S. in Meteorology from Florida State University with a Minor in Mathematics, Dustin began taking online courses to pursue a certificate in computer programming. During this time, he received a temporary Pathways Meteorologist position at the National Weather Service office in Reno, N...

Meet your Mets: Meteorologist Heather

Image
 We have had quite a few meteorologists and staff come and go over the years, so we figured it was time to introduce you to some of the newer forecasters. Heather has been working with us at NWS Reno since mid August and is quickly familiarizing herself with the quirks of eastern Sierra and Nevada weather.  Welcome to Heather!  Heather first became interested in meteorology as a child growing up in Michigan, witnessing many storms, floods, and winter events. Her family lived along a river in a flood zone, and had three separate occasions of complete inundation of their house. Her undergraduate degree in meteorology (Central Michigan University) and Master’s degree in geography (Ball State University) allowed her to study the hydrological and meteorological relationships responsible for the flood events that led to the inundations. Heather used GIS, hydrology, and meteorology to model flood behavior for flooding related to frozen versus unfrozen soil conditions. She was s...

Climate Newsletter May 2021

Image
(2-3) Image source:  https://climatetoolbox.org/tool/Climate-Mapper (4) Image source: nrcs.usda.gov (5) Image source: drought.gov (6-8) Images source:  https://www.cpc.ncep.noaa.gov (9) Image source:  https://rangelands.app/great-basin-fire (10) Image source:  https://www.ncei.noaa.gov (11) Image source:  https://mesonet.agron.iastate.edu/plotting/auto

NWS Wind Forecasts: AKA What's the Deal With Friction?

Image
We have had a number of comments on social media which mention much lower observed wind speeds locally than are in the forecast. Well, you are unlikely to know this (it is not exactly advertised!) but National Weather Service wind forecasts are for 10 meters, or almost 33 ft, above the ground. As we are about to explain, that makes all the difference in the wind between eye-level (~5-6 feet) and ~33 feet.  It is natural to wonder the purpose of a wind height forecast well above where you and I typically reside. The main reason for this is the complication in forecasting wind as one nears the ground due to frictional influence caused by the surface. Here is a diagram showing the concept of wind speeds change as one gets away from the ground.  As you can see above, there is a rapid speed reduction (gray dashed line) near the ground with a lesser change away from the surface. Note that the above diagram is generalized. How much reduction is realized depends on the nature of the s...

Drought Report March 19, 2021

Image
  Drought Update Report  NWS Reno  Issued: 03/19/2021  Schedule: Monthly during periods of extreme drought designation  _____________________________________________________________________  Drought conditions persist  Synopsis: Precipitation and snow accumulation in February and the first half of March were well below average for the Sierra, and pretty much closed the door on the odds of recovering snowpack and water supply conditions to near average with only a few weeks remaining in the typical snow accumulation season. Conditions were somewhat better in far northeastern CA and northwestern NV, but still well short of significant drought recovery. Mid-February storms were most beneficial to northern Nevada, but precipitation since February 1st is well below average for SNOTEL stations on the east side of the central Sierra (Figure 1). The past 30 day mountain precipitation was even worse throughout the state, but especially for the Sierra where site...

Climate Newsletter January 2021

Image
Image source: Westwide Drought Tracker... https://wrcc.dri.edu/wwdt/ Red X = approximate location of Reno-Sparks. Percentile: 100th percentile (darker green) would mean an area had their wettest precipitation period as compared with past October-December or December periods in the climate record. 0th percentile (dark brown) would be the driest. Therefore, for the October - December period, most areas in eastern CA and western NV received precipitation in the lowest 1/3rd of other October-December periods in the climate record.

East Wind Events: Windy Up "There", Not-So-Windy Down "Here"

Image
Gusty Ridges, Calm Valleys.  We have gotten a lot of questions lately about why it's so windy up in the mountains and why there are  no winds down in the valleys, so we figured we would write up a quick blog post about it. Let's talk  observations...these are just a spattering of observations from an event we had this week  (Dec 6-8, 2020). Notice the big difference between the ridges and the valley locations.  Let's not get stuck on the actual numbers at the ridges, since some of those sensors can get a little 'off' once wind speeds really pick up, the more important thing to note is the large differences in the wind  gusts from ridges to foothills to valleys. (note obviously Peavine was having a bit of trouble too)  We want to dig into how this occurs and why it happens! So if you're brave and ready for some science,  then continue onward. General Weather Setup  It is a well known set up and similar to previous events, but the magnitude of...