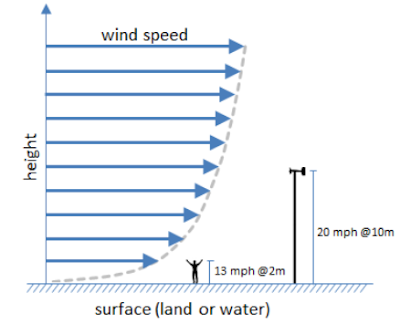
We have had a number of comments on social media which mention much lower observed wind speeds locally than are in the forecast. Well, you are unlikely to know this (it is not exactly advertised!) but National Weather Service wind forecasts are for 10 meters, or almost 33 ft, above the ground. As we are about to explain, that makes all the difference in the wind between eye-level (~5-6 feet) and ~33 feet. It is natural to wonder the purpose of a wind height forecast well above where you and I typically reside. The main reason for this is the complication in forecasting wind as one nears the ground due to frictional influence caused by the surface. Here is a diagram showing the concept of wind speeds change as one gets away from the ground. As you can see above, there is a rapid speed reduction (gray dashed line) near the ground with a lesser change away from the surface. Note that the above diagram is generalized. How much reduction is realized depends on the nature of the surface wh