Posts

Showing posts from May, 2015

The Science of Colorful Sunrises and Sunsets

Image
A picture perfect sunset - something that sky watchers everywhere love. So, why are some sunrises and sunsets so spectacular? Lets talk about the science behind these awe-inspiring features. To start we'll take a step back and think about how the colors of the sky are produced, which has to do with how light is scattered. Scattering refers to the reflection or redirection of light by smaller particles. Rayleigh scattering refers to the scattering of light off of the molecules of air. The particles of air are much smaller than the wavelengths of visible light and therefore air is an excellent Rayleigh scatterer. Visible light is composed of a spectrum of colors ranging from reds and oranges on one end of the spectrum and blues and purples on the other end. Anyone remember the acronym Roy G. Biv? Photo courtesy of: Globalspec.com Each color has a different wavelength , with the wavelength of violet light closer in size to air molecules than the wavelength of red light

Day in the Life of a Fire Weather Forecaster

Image
So what exactly occurs during a fire weather forecaster shift during the fire season? We are going to break it down for you. Obviously the day could be way more/less busy if we have ongoing fires or the weather is quiet, but this is just to give you an idea of how the day is laid out! 7:00 AM - The shift officially begins with a briefing from the overnight forecaster. This is our time to ask what changes were made to the forecast, how have the models been trending, and if there were any equipment issues overnight. 7:30 AM  - Look at new incoming forecast model data, review fire reports available from the National Interagency Coordination Center ( NICC ) and prepare for upcoming conference calls and briefings.  8:30 AM - 10:00 AM - We participate in a couple of conference calls with our fire partners, which include the Southern California Geographical Coordination Center (aka SoCal GACC), the Northern CA GACC, and with the Great Basin GACC. These conference calls are w

Tools of the trade (Skew-T Soundings)

Image
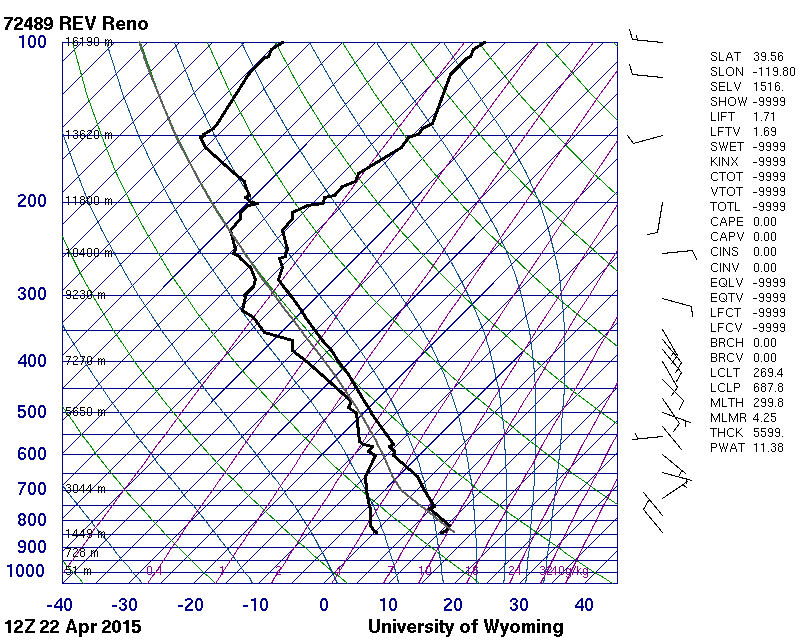
I am sure that some of you have seen the entertaining videos of weather balloon releases that we have done at the NWS office, or maybe you have been lucky enough to be here in person when the balloon launch occurs. But what happens with this data and how does it assist us with predicting weather? Since we have already had thunderstorms this year (June came early), let's focus on how we utilize the weather balloon data to determine the potential for thunderstorms. Let's start from the beginning...Everyday one of our meteorologists releases a balloon at 11Z and 23Z. You are probably thinking 'Z?' Well it is called 'Zulu' time which you might know as 'GMT' (Greenwich Mean Time).  It is a standard measure of time we utilize here at the Weather Service offices to ensure all of our data and products get issued around the same time of day worldwide. All balloon launches world-wide are released at 11Z and 23Z! Anyways, back to the balloon launch. Not only