Tools of the Trade: WSR-88D aka Doppler Radar
Welcome back! Glad that we haven't lost your interest ;-) It has been an incredibly busy couple of weeks with all of the thunderstorms across northeast California and western Nevada. Since it is thunderstorm season we thought this would be a great topic to discuss! Today we are going to focus on one of our most important tools of the trade, the doppler radar, aka WSR-88D (Weather Surveillance Radar 1988 Doppler). Radar was invented during WWII and many surplus radars were given to the Weather Bureau (now the National Weather Service) after the war. WSR-57 and WSR-74 were the first radars built specifically for weather detection. WSR-88D was the first radar that could detect particle motion and they were deployed across the country in the mid to late 1990s. The current WSR-88D network includes 160 radars across the country as well as Alaska, Hawaii Puerto Rico and Guam (not pictured).

Radar is an acronym that stands for RAdio Detection And Ranging, but how does it work?
- Radar transmits a burst of radio waves.
- These waves bounce off of objects, like raindrops, snow, dust, birds and some of the energy is reflected back to the radar's receiver.
- The amount of radio wave energy scattered back to the radar determines the object's reflectivity.
Reflectivity is a function of:
- Size (radar cross section)
- Shape (round, flat, etc.)
- State (liquid, mixed, dry wet, etc)
- Concentration (# of particles in a volume)
All of these characteristics of reflectivity help us to determine what the radar waves are hitting when they are transmitted. Is it hitting rain, snow, dust, birds or bugs? The latest addition to the radar has been the upgrade to dual-polarimetric (Dual-Pol) technology that transmits radio waves oriented in the horizontal and vertical direction. NWS radars upgraded to dual-pol between 2011-2013. The dual-pol technology allows us to sample the size and shape of objects. This allows us to gather more details to improve estimates of precipitation type, intensity, as well as highlighting the difference between precipitation and non-precipitation echoes.

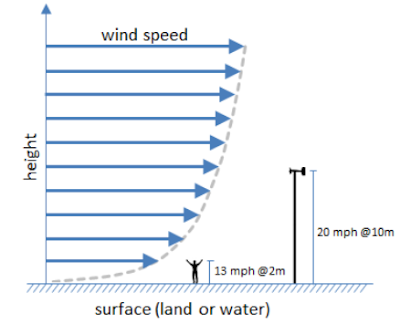
We are going to focus on a couple of the products we produce from the radar data and how we use them. Let's start with base reflectivity. Taken from the lowest elevation scan, base reflectivity is excellent for examining the region around the radar to look for precipitation. However, the radar beam increases in elevation as you get further away from the radar (shown below).

This is a problem that we deal with at NWS Reno since our radar is located on the top of Virginia Peak (elevation 8,370 feet) as noted by the fancy red arrow on the map below. Something about how the radar can't see what is going near the ground, and plug how spotters, facebook reports, yadda yadda helps us out. Base reflectivity gives us a basic idea of the type of objects in the air, but we do need to use other products to get a more exact determination. Here is an example of base reflectivity from the NWS Reno Radar from June 10th, 2015. The light green shades are typically rain or snow, and the higher the reflectivity values (into the yellows and reds) then we will usually pay more attention to those areas. Notice in the areas of red and yellow southwest of Lovelock and moving along Interstate 80. Those storms were putting down some pretty heavy rain and maybe even some small hail right across the interstate. Depending on the existing atmospheric environment, these storms can also put out some pretty hefty winds with gusts around 50 to 60 mph! To say the least, if we are seeing reds and yellows on the base reflectivity, we are definitely starting to pay more attention to those areas then the light green shades.

Next product that we will discuss is base velocity, which displays the average wind speed of particles that are detected by the radar. The radar can measure the speed due to the Doppler effect, in which the frequency of a wave changes as it bounces off a particle that is moving with respect to an object that is not moving (the radar). Shown below is an example of base velocity that illustrates an EF2 tornado in Baker County Florida on April 15, 2007. Green colors indicate velocities towards the radar while red indicates velocities moving away from the radar. As you can see in the animation, the most interesting areas are where red and green colors meet, especially when the values are large!

That wraps up our quick talk about just a couple of the radar products for now, but keep an eye out for future posts, especially about some of the dual-pol products! Check out the short video below that gives a tour of the NWS Reno radar on top of Virginia Peak.
As always if you have any questions feel free to email nws.reno@noaa.gov