Climate News - September 2020
________________________________________________________________________________
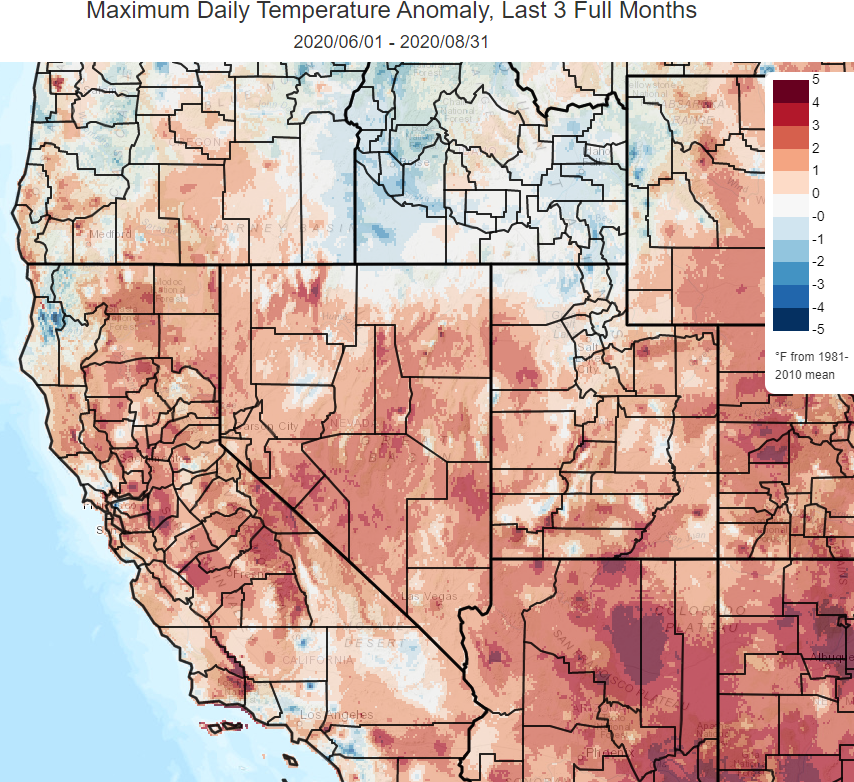
So, what’s been happening from a climatological perspective across northeast California, the Sierra, and western Nevada? Summer high temperatures ran considerably above average when compared with the averages from 1981-2010 (the last climate period used for comparison). By examining the summer highs (June-August), you can see that most spots were well above average (1.5 to 3 degrees over a season is notable).
Temperature and precipitation anomaly maps courtesy of https://climatetoolbox.org/
As f
Low temperatures this summer, they were around average (not shown) for areas around Fernley, Fallon, and Lovelock, with most of eastern California, western/northwestern Nevada, and Mineral and southern Lyon counties around 1 and 3 degrees above average. One might think that the above average lows could be due to the urban heat island effect; while this is likely a factor in places like Reno-Sparks, most areas outside of urbanized areas also saw the bump.
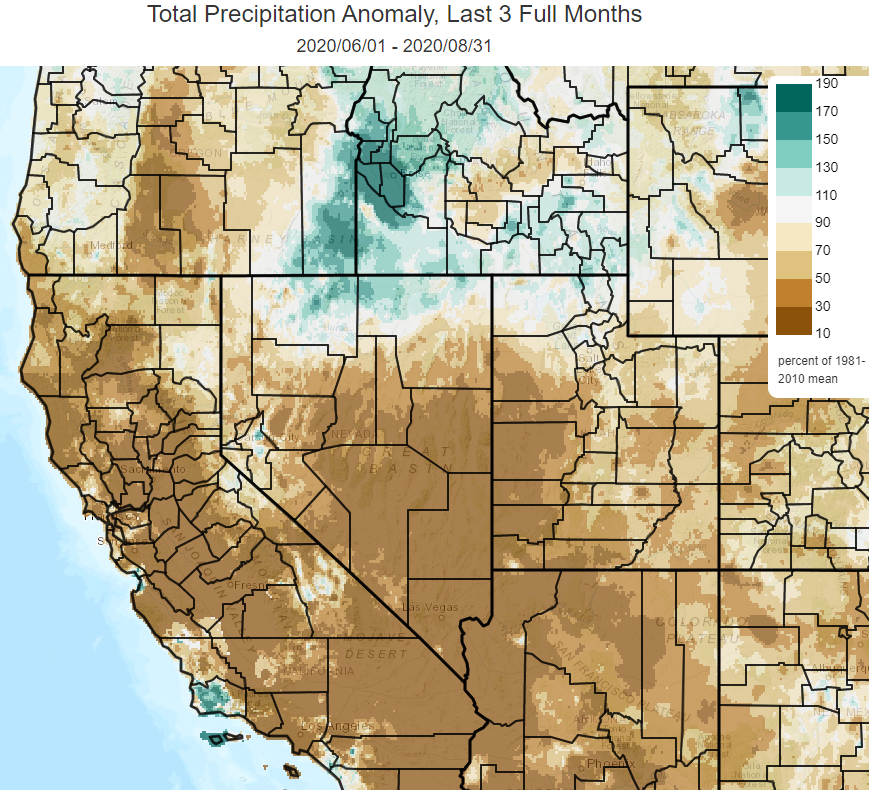
Precipitation over the summer was, as you can see from the image below, mostly below average for many locations across the southwestern CONUS. There were pockets of close to average precipitation in eastern CA and western NV...at least partially due to periodic thunderstorm formation. Note that from June-August the region typically receives less than 2 inches of precipitation as it is reliant mostly on hit-and-miss thunderstorms or the occasional late spring system.
What is the EDDI?
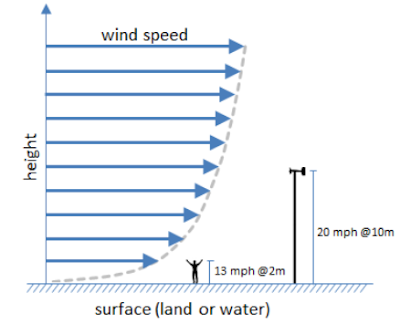
Finally, let’s take a look at a measure of the evaporative demand or thirst of the atmosphere over the summer. It is called “EDDI” for evaporative drought demand index and it looks at temperature, humidity, windspeed, and solar radiation to determine how much ground moisture has been lost to (or gained from) the atmosphere over a given period. It then compares the gain or loss to the 1979-2016 climatology to find out if evaporation loss to the atmosphere has been more or less than is typical. It can be used to see where excessive ground moisture loss to the atmosphere is exacerbating drought conditions.
Directly below is a look at the EDDI between mid-June and mid-September versus the 37-year average for the same 3 month period. Breaking down this period further, the two 1-month images for mid-August (below left) and mid-September (below right) show the progression of the evaporative loss, with the mid-September image indicating that much of the increased ground moisture loss has occurred towards the tail end of summer. In fact, only 2% of the past mid-August to mid-Septembers between 1979 and 2016 indicated as much loss as 2020.
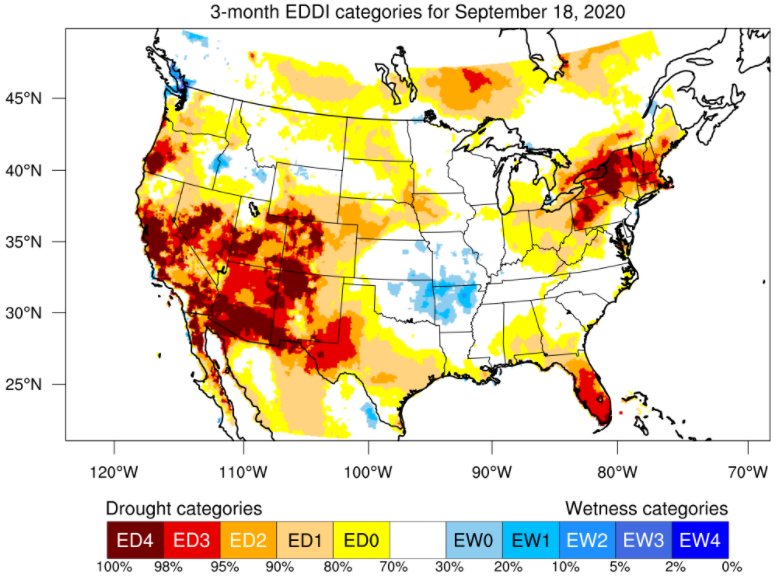

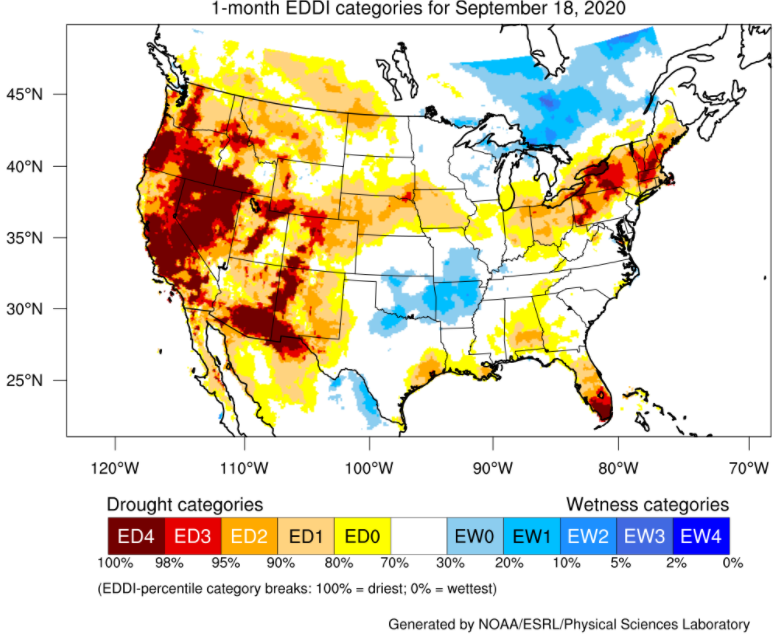
Note: Images provided by the NOAA/ESRL Physical Sciences Laboratory, Boulder, Colorado, at: https://psl.noaa.gov/.
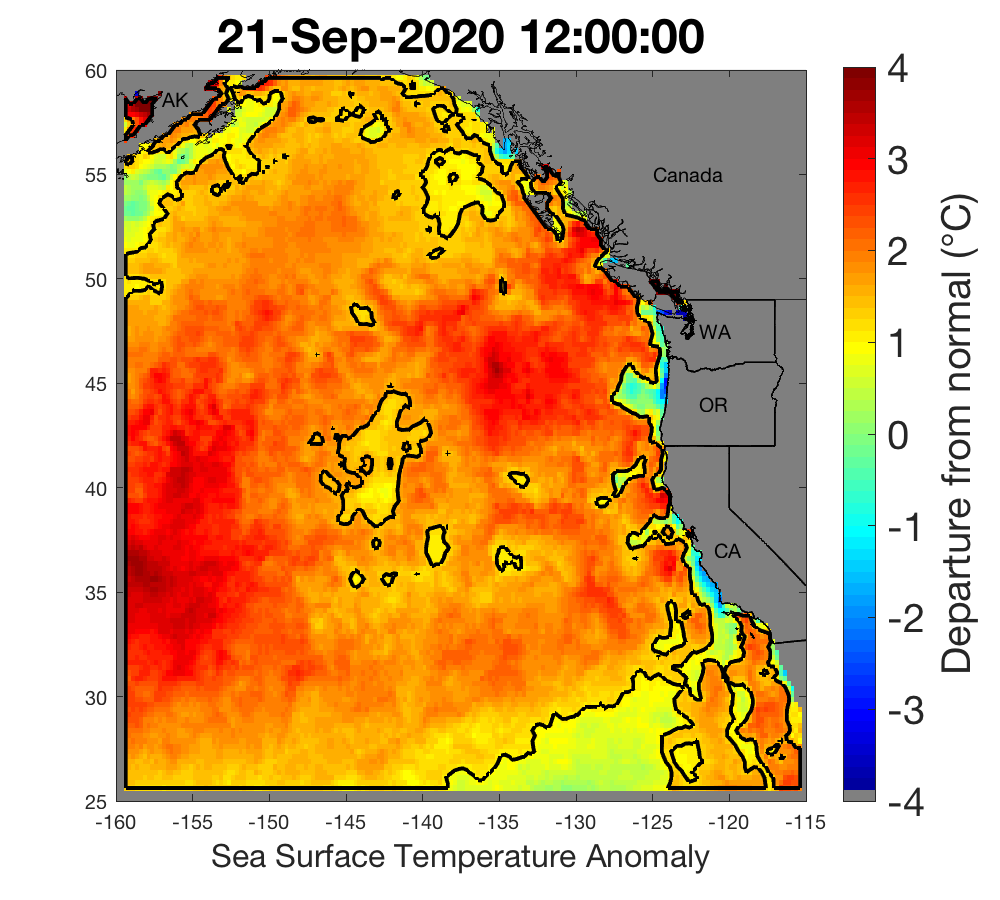
Yet Another Marine Heat Wave For the North Pacific
A “marine heat wave” (MHW) occurs when ocean temperatures are much warmer than usual for an extended period of time. MHWs are of concern as researchers have documented many ecological effects including harmful algal blooms, shifting distributions of marine life, and changes in the marine food web. Several MHWs of note have occurred since 2014. MHWs in the 2014-2016 (aka “The Blob”), 2019, and 2020 time periods are the three largest in size since monitoring began in 1982. This year’s MHW has just recently increased in size to become the largest since 1982. Below is an image showing sea surface temperature anomalies with the area surrounded by the black line corresponding to the marine heat wave.
Below’s chart shows the relative size of MHWs since 1982. You can clearly see that the events since 2014 are by far the largest.
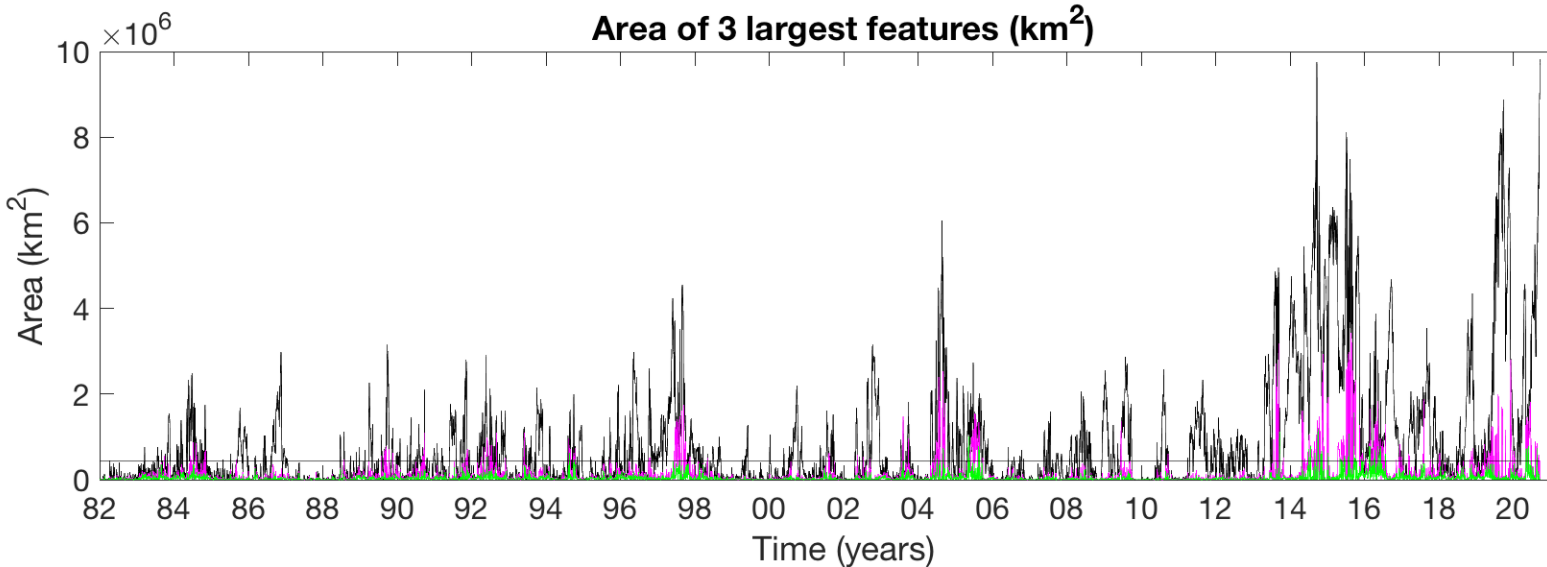
Note that we at the NWS in Reno are no experts on MHWs and their effects. For more information on MHWs from researchers, see the sources below or visit http://www.marineheatwaves.org.
Sources (NOAA): California Current MHW Tracker and Coral Reef Watch
________________________________________________________________________________
Updated Climate Normals From NCEI Coming in 2021
The National Centers for Environmental Information (NCEI) is responsible for collecting vast amounts of data in order to create 30-year normals with which to compare to current weather and climate events. New 30-year normals are created every 10 years, with the 1991-2020 period expected to be revealed no later than May 1, 2021. To keep up with the pace of climate change, there is talk of providing 15-year normals every few years if NCEI resources allow.
If you would like to check out various climate information for stations around northeast California, the Sierra, and western Nevada, go to our NOWData page. Note that NOWData is available for all National Weather Service offices...just go to weather.gov and pick your area of choice!
NOWData page image:
Well, that wraps it up for this climate newsletter. Stay safe and we’ll catch you all next time (probably early 2021)!

Your NWS Reno Climate Team