Climate News - April 2020
CLIMATE NEWS
April, 2020
Hello folks! The National Weather Service in Reno hopes you are doing well during these unusual times. This will be the first edition of a periodic newsletter that will contain summaries of various aspects of the climate, mainly across northeast CA, the Sierra, and western NV but sometimes on a continental or global scale.
NOTE: if you have any questions or would like clarification on what is presented in this or future newsletters, feel free to shoot us a message on Facebook (https://www.facebook.com/NWSReno/) or email w-rev.webmaster@noaa.gov
Alright, let’s start with a summary of the recent precipitation and temperature trends around the region. Here are a couple maps showing that the region has generally been warmer than average temperature-wise (+1.6 degrees at Reno) with well below average precipitation (48% Reno) since late January. Source: https://climatetoolbox.org/


The notable lack of precipitation has led to a below average snowpack for the Sierra. The graphic (right) shows the current Truckee River drainage snowpack (black line) compared with the minimum (red line), median (green line), and record high (purple line) snowpacks of the past few decades. You can see how the “snowfall tap” shutoff (black line went horizontal) after a promising wet season start in December. Although there were a couple good snowpack building weeks in March - early April; it wasn’t nearly enough to boost the snowpack back to significant levels.
Finally, note the rapidly dropping black line for the current water year snowpack. The melt season is now underway (sun intensity really ramping up!) so the time to accumulate snowpack for this water year (October-September) is over.
___________________________________________________________________________________________________________________
So what are the climate (vs shorter term weather) predictions going into the rest of spring and summer?
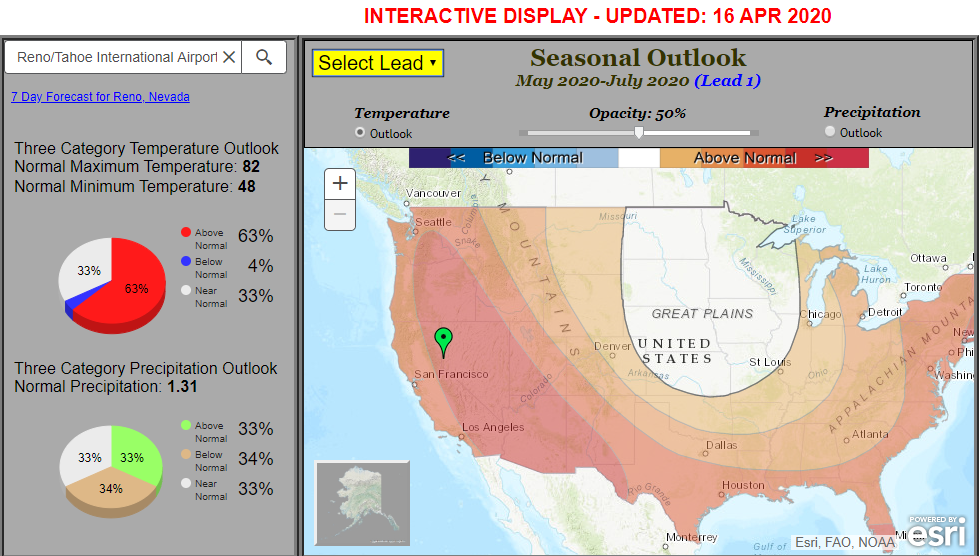
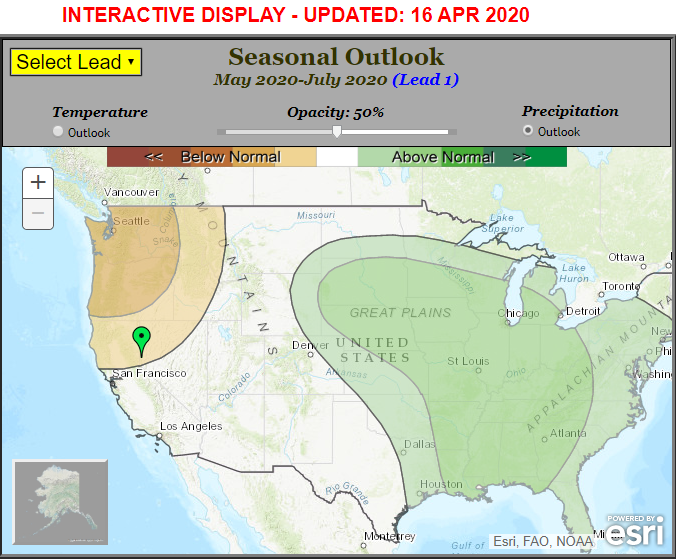
The prediction is for a good chance (over 60%) for above average temperatures, some of which can be attributed to the long-term trend of rising temperatures and some to the expected large-scale patterns. This does not mean no below normal conditions will occur with that being possible from weekly fluctuations in weather patterns. It just means that above average overall is expected when you put all the high and low temperatures together for May, June, and July. Precipitation-wise, northeast CA, the Sierra, and western NV show nearly equal chances (EC) for above or below precipitation. EC often means that there are no known climate signals to determine which way precipitation will turn out (above/below normal).
* TECHNICAL DETAILS... (skip) if you hate statistics!

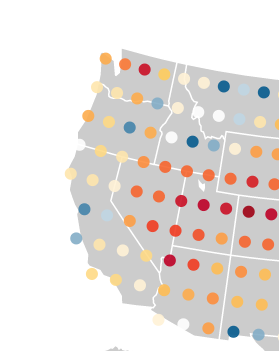
It should be noted that while temperature outlooks have definite skill over a complete guess, seasonal precipitation outlooks show much less skill. The “Heidke Skill” scores for the spring-summer period over the past 10 years are shown below. If an area is less than zero (white/blue shading), the forecast shows worse skill than a complete guess...while oranges and reds (greater than zero) show increased skill over random guesswork. As you can see, the temperature areas (left image) show improvement over a random guess for the Sierra, northern CA, and far western NV while precipitation (right image) indicates very little skill over a guess! Note that this varies by season and is inherently less predictable in the spring and fall seasons versus the heart of summer or winter.
Source for images: https://vwt.ncep.noaa.gov/


Finally, a global-scale phenomenon update...
WHAT’S EL NIÑO UP TO??
Lastly, we will throw in a little bonus material which will vary from newsletter to newsletter. For this month, we will discuss the current El Niño/La Niña situation and a little bit about what tips the Climate Prediction Center into defining an event as El Niño or La Niña.
Recent sea surface temperature conditions across the tropical Pacific Ocean indicate above normal readings (yellow/orange shades). Sea temperatures have been generally around 0.5 to 1 degree (Celsius) above average since last fall in the central and east-central equatorial Pacific. Why is this important?

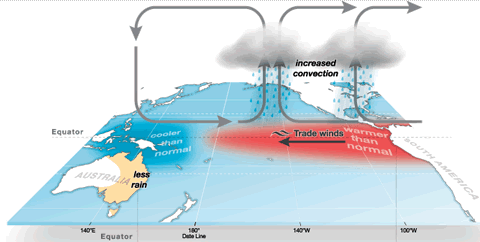
Above normal sea surface temperatures increase thunderstorm potential as higher temperature water can support rising air and moisture transport into the atmosphere better than colder water. When clusters of thunderstorms develop in the central and eastern tropical Pacific they can in turn affect the atmospheric patterns and storm trains up into the mid-latitudes, especially during the winter months. The images below show the average atmospheric circulations (left) in the tropical Pacific and the changes wrought by warmer eastern Pacific waters (right).

Now for the crux of the matter. To declare an El Niño, the Climate Prediction Center (CPC) looks at both the above normal sea surface temperatures AND the effect they are having on the atmosphere. If the warmer waters are not causing atmospheric changes, then no El Niño is declared. That is exactly what is occurring lately as the waters are not causing the atmosphere to respond in a meaningful way. CPC is calling the current situation “warm El-Niño neutral conditions”.