We have had a number of comments on social media which mention much lower observed wind speeds locally than are in the forecast. Well, you are unlikely to know this (it is not exactly advertised!) but National Weather Service wind forecasts are for 10 meters, or almost 33 ft, above the ground. As we are about to explain, that makes all the difference in the wind between eye-level (~5-6 feet) and ~33 feet.
It is natural to wonder the purpose of a wind height forecast well above where you and I typically reside. The main reason for this is the complication in forecasting wind as one nears the ground due to frictional influence caused by the surface. Here is a diagram showing the concept of wind speeds change as one gets away from the ground.
As you can see above, there is a rapid speed reduction (gray dashed line) near the ground with a lesser change away from the surface. Note that the above diagram is generalized. How much reduction is realized depends on the nature of the surface which the wind is moving over including ground cover (vegetation, trees, concrete, etc.) and the number of structures and their heights. The surface nature is referred to as the "roughness length" in friction equations. Below is a chart showing the concept with increasing friction as you go down the list. Generally, the more obstacles in the way the more friction!
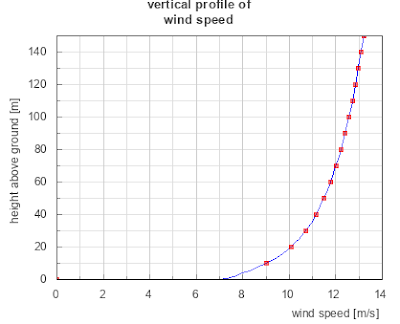
So let's plug in a couple different land cover types and see the effect on near-surface winds. We have chosen 9 meters per second (m/s) or ~20 mph for a 10 meter/33-foot wind as that might be a typical speed forecast in western Nevada on a windy day. For open agricultural land without fences or hedges with gently rolling hills, here is the chart...
The lowest red marker indicates a ~20 mph wind at ~33 feet. If you follow the thin blue line to the left from the marker, you can see the reduction in speed between the surface and 33 feet.
So, at 2 meters or ~6.5 feet off the ground, the speed is an estimated 7.5 m/s or ~16.5 mph where the speed is ~20 mph at 33 feet (reduction of around 17%).
Now, let's look at the chart for a much more friction-laden environment such as a larger town with high buildings...
Following the thin blue line, a ~20 mph wind in a larger town is estimated to drop to ~9.5 mph (or more than 50%) due to friction!
Note that we have a lot of "estimated" and "abouts" (~) in this article. Well, as is often the case in a chaotic fluid (yup, air is a fluid!) such as the atmosphere, the equations used to calculate values have assumptions and estimates built in as the exact, small-scale state of the fluid are unknown. Incidentally, this is why forecast models go askew after awhile as the small-scale unknowns/errors multiply over time. For winds, the small-scale details of surface features and vegetation are highly complicated so friction estimates are given via the general character of a land surface and can omit very small-scale details - for example, your house!
To wrap it up, National Weather Service wind forecasts are for ~33 feet (10 meters) off the ground due to the complicated and highly variable effects of local friction at the surface. The spatial forecast resolution necessary to resolve all local effects on wind speeds would be so small as to render the forecast for NWS Reno's area impractically large to produce. Finally, models ingest sensor data mostly situated at ~20-33 feet off the ground to compute their forecasts and the NWS uses those sensors for verification, thus making ~33 feet an appropriate level for wind forecast output. So the next time you hear that winds will be 15-25 mph with gusts to 40 mph, check out your current location and consider that might not be what you experience at the ground!


